Appendix 2
Model Tests with M/S Estonia (Supplement No. 410)
An Analysis by Heiwa Co of SSPA Report no. 7524 of 951205 by Peter Trägardh (SSPA Marine AB)
This little report is an analysis of SSPA report no. 7524 of 951205 written by Mr. Peter Trägardh about loads applied on ships' bows above waterline in a seaway. The conclusion is that the report cannot be trusted and/or is misleading. Actually the model tests are falsified to provide misleading conclusions!
In 1. Introduction it is stated that model tests of M/S 'Estonia' were carried out on behalf of the Swedish Accident Investigation Board, SHK. The purpose of the tests was to measure the wave induced loads on the bow visor in severe weather. The main objective was to get a good statistical basis for estimation of actual loads on the visor. Comment - this was a good objective - without correct load estimates you cannot design a structure of any kind. It is further stated that the test program was decided in co-operation with a SHK representative who was also present at the tests. This might not have been a very good idea - it gives the idea that the SHK influenced the tests. The SHK representative was Börje Stenström who participated in the falsification of other investigation reports - stability, strength of material, etc. as described elsewhere in the book Disaster Investigation. It is evidently much easier to do full scale tests with real ferries in severe weather; just increase the speed and hit the incoming waves with the bow. You will then experience a very noisy impact at >130 dB- like being hit by a cannon ball - followed by vibrations of the whole ship! The 'mpact is caused by compressed, captured air between wave and bow surfaces, pressure of which makes the hull steel plate between stiffeners vibrate, etc., before the water splashes away in all directions. It is in fact simply impossible that waves knock off bow visors. But with model tests you can invent anything.
In 2. Model test data it is stated that the tests were done June 19-20, 1995, in towing tank and June 28 - July 1, 1995, in the Maritime Dynamics Laboratory (MDL). Comment - note that the report was issued 5 months after the tests were completed - why was the report so late?
In 3. Wave tests in the towing tank it is stated that the main objective of the tests (in the model tank) was to measure forces and moments on the bow visor caused by the wave impact(s). Test runs nos. 4-42 and 46-51 were run in the towing tank. Comment - for the first time is it stated that the wave load is a short time impact. Actually the wave loads measured in the towing tank were not impact loads but normal buoyancy/added mass loads, when the fore body/visor was submerged in water > 3 seconds (the visor 2 seconds). Total 45 runs were made and this took about 5 hours, i.e. each run took 6 minutes 40 seconds in the towing tank.
In 4. Wave tests in MDL it is stated that test runs nos. 7-13, 15, 18, 20, 22, 34-37, 39-40, 45-46, 48-55, 56-66 and 67-116 were run in the MDL. Comment - in order to avoid confusion of tests in towing tank and MDL, it would have been better to number the runs in the MDL starting at 52. There were about 88 runs total and about 3 hours time, i.e. each run was about 2 minutes long. 60 runs were made in the actual 'Estonia' accident conditions, viz. 14.5 knots, bow seas, wave height 4.3 meters. This means about 2 hours model time, which represents 6 hours full scale time. However, it seems only 3 hours full-scale results are available.
In 6. Results and conclusive remarks it is stated that the measured vertical Z-force has been corrected for the difference in mass of the model visor (127.8 tons in full scale) and the full-scale visor (53.0 tons) to a nominal value called Z-force nom. It is then stated that also the pure dynamic wave load, Z-force dyn, has been calculated. It is further stated that it should be noted that the weight of the visor is not (sic) included in the Z-force. Comment - as it is the total Z-force - the total vertical load on the visor including the weight of the visor - which is of interest, it is quite confusing that the report states that this force is divided into a Z-force nom and a Z-force dyn and that the weight of the visor is not included (in the Z-force). Later only Z-force is given. What was actually measured as Z-force? It seems that this statement maybe was made to confuse the report and the results. I think the Z-force (and X-force) has been manipulated. The reason is given below.
It is then stated that the results from these model tests are similar to what could be expected in view of tests of bow loads on ro/ro ships carried out 7 March 1995 (not included). This is a surprising statement in a report - why was it necessary to state that these results of the 'Estonia' were similar to other results obtained previously?
Analysis of the SSPA Results with Comments - How the Loads on the Visor in regular Waves were faked
Run 47 in the towing tank - figures 12a-e in the final SSPA report - shows what allegedly happens in regular head waves.
The wave profile (fig 12a) shows the wave amplitude (height) of about 4.0 meters and the encounter period is about 6 seconds (as the ship is heading with speed 15 knots into waves with a period of 9.3 seconds). This is in order.
The relative motion (fig 12b) at the bow - the distance between the ship's still water waterline and the wave surface - is also correct, i.e. its amplitude is about 5 meters. This means that the ship puts its bow with visor about 5 meters into the wave and lifts it about 5 meters out of the wave at each wave encounter. As the moulded draft forward was 5.17 meters, this means that the bow was almost completely out of the water then. Nowhere in the report is it stated that the bow visor only starts to be submerged at a relative motion -2.45 meters (when the wave reaches the car deck level, even if a little bit of visor is below the car deck - see fig 4) and that the top of the visor is at a relative motion of about about -7.45 meters, which was never reached (because the freeboard/main deck is 7.62 meters above the keel and the visor top is at about 12.62 meters above keel, disregarding the bulwark on top of the visor). Unfortunately, the relative motion aft is not measured, i.e. we do not know, if the propellers were out of the water during the tests. No photos of the model aft during the tests are shown.
The vertical, lifting Load
The Z-force (fig 12d) (vertical), where the visor weight (0.53 MN) is not included (see above), seems logical in behaviour but not in magnitude - every time, i.e. every 6 seconds, when the bow is put into a wave, the Z-force becomes about -1.5MN (150 tons), which should be due to the buoyancy of the visor (Z-force nom?) plus the force by an added mass of water (Z-force dyn?), which together seems very high - 1.5 MN.
By deducting the visor weight 0.53MN it is concluded that the actual lifting load on the visor in regular seas would be about 1.0 MN, i.e. 100 tons lifting the visor free of its supports. The visor is then held back by the locks. As can be seen in fig 12b, the Z-force starts to build up, when the relative motion is about -2.0 meters, i.e. when the visor starts to be submerged, and then it increases to 1.5 MN in one second and is then zero again after another second, when the visor is out of the water. Actually a Z-force of 1.5MN (150 tons) in regular seas seems quite high, considering that only 2.5-3.0 meters of the bottom part of the visor is submerged in the wave, which does not include much buoyancy - say max 30-40 m3.
How submerging 30-40 m3 of visor in water produces a lifting force of 1.5 MN (150 tons), as allegedly measured in the test, is not known. The writer is not aware of any scientific method to calculate full scale forces on a ship part above waterline based on forces measured in model tests ! The force consists of many components that follows different scale laws; thus you must separate the force measured in model test into its various components, re-calculate each component to full scale and add all full scale components to get the total full scale force, etc! Local pressures can on the other hand be scaled up - but no pressures were measured in the tests.
Anyway - the force has to be corrected for visor weight (-0.53MN) and then the regular, total force on the five visor locks and hinges were only about 100 tons, or 20 tons per connection. One question is - was the Z-force gauge actually properly calibrated? It seems that the Z-force gauge was set to produce a higher value (so that SHK/Stenström could show that bigger loads, than expected, had acted on the visor).
In my opinion, submerging the visor in regular waves as shown above would produce a lifting buoyancy static force of about 50 tons, to which we could add a dynamic force due to added mass of water 20 tons, i.e. the total upward peak load was 70 tons, which was reduced considerably by the visor weight 55 tons. The surprise would then have been that very little upward positive load on the 55 tons visor was recorded in regular seas test no. 47. This could hardly be reported in the final report, so one way or another SSPA produced fig. 12d showing that a big load -1.5MN (150 tons) acted on the visor (and no correction for visor weight) and lifted it free of its supports every 6 seconds and that afterwards the visor crashed down on its supports with 55 tons!
It seems no sudden impact loads were recorded in regular waves!
The horizontal, braking Load
The X-force (horizontal) on the visor - fig. 12c - is produced when the submerged visor is being towed through the water, i.e. only 2-3 meters of visor is submerged and that seems to produce a 1.5 MN braking force - 150 tons. What is surprising here is, that this force does not stop the ship or at least reduces the speed considerably!! The two propellers hardly produce more thrust than 1.0 MN (100 tons). So in my view the X-force is also completely unrealistic. It seems that the loads measured on the visor in regular waves are 100% faked. These tests can never be repeated by independent scientists!
Note - maybe a power of about 10 000 kW (SHP) were used to turn the propellers of the vessel at 14.5 knots. Of the 10 000 kW say that 7 500 kW was used to produce the thrust (EHP) that pushed the vessel forward at 7.5 m/s speed. This means that the thrust (force) to push the ship forward was 1.0 MN (effect EHP divided by speed), i.e. 100 tons. In the SSPA report fig. 12c a braking force of 1.5 MN on the visor was produced every 6 seconds lasting 1.5 seconds, which should have been enough to reduce the speed considerably. The X-force seems therefore excessive, too! Of course the X-force always reduces the speed of ship, but this is hidden by the fact that engine power is often reduced in heavy seas. As we do not know the relative motion aft, we do not know, if the propellers were below water all the time to produce a forward thrust of 100 tons. As soon as the propellers are out of the water, the engines will race and you have to slow down the engines, which reduces the forward thrust and speed.
The opening Moment
In figure 12e it is shown that the X and Z-forces cause a Yh-moment (around the hinge on the upper deck) - Positive opening, which varies between maximum +1.1 MNm (opening) and -2.5 MNm, i.e. a negative closing moment. This means that in regular seas the load on the visor would hardly open the visor (because to open the visor you need a higher moment). This seems very logical - there should have been so little actual X- and Z-forces on the visor in regular seas, which could never open the visor. (The weight of the visor 53 tons at 5 meters forward of the hinge causes a closing moment of 2.6 MNm. When the visor fills with water - and if we assume that weight some way or another is attached to the visor - the closing moment - visor and water - increases).
It should be quite clear to anyone, that the loads on the visor are cyclical and that the supports (the locks) are subject to fatigue. It is interesting to note that in the Final Report it was stated that the breaking load of the locks was overload in tension, not fatigue.
How the Loads on the Visor in irregular Waves were faked
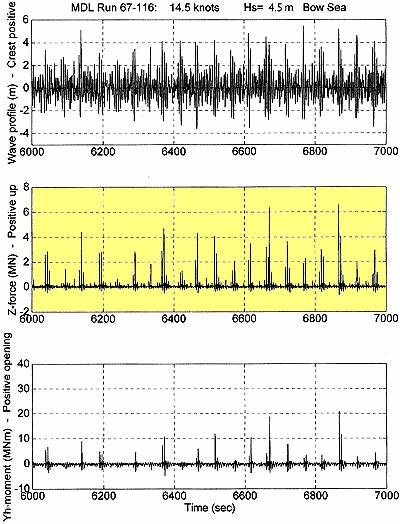
Runs nos. 67-116 in the MDL - figures 13a-e in the report - are supposed to show what happens in irregular Bow Sea with mean wave height 4.3 meters and ship speed 14.5 knots.
Only 1 000 seconds between time 6 600 and 7 600 seconds are shown in the report, i.e. 16 minutes and 40 seconds. Reportedly total 3 hours - 10 800 seconds of (full scale) test was done, i.e. we are shown 9.25% of the total results.
Figure 13a shows the wave profile, which varies from max +3.5 meters to -5.2 meters. Figure 13b shows the relative motion at the bow, which varies between ± 6.5-7.0 meters, i.e. very often the whole bow is out of the water - draft 5.17 meters - and very often the bow is submerged 7.0 meters, which means that the visor is submerged about 5.05 meters, i.e. only halfway to its extreme top, see fig 4 of the SSPA-report. What happens now in irregular seas?
Fig 13c and fig 14d show the braking X-force acting on the ship (and the visor) in irregular waves. As shown above the X-force will reduce the ships speed, as it exceeds the average thrust of the ship's propellers, which is 1.0 MN. Very often, > 40 times, big horizontal (?) impacts >1.0 MN occurred according to fig 13c during 16 minutes 40 seconds, which in fact would have reduced the ship's speed considerably. More than 40 times during 17 minutes the visor is alleged to have been hit by a horizontal, opposing force >100 tons - nobody aboard noticed this behaviour. And we do not know what happened aft - were the propellers always in the water?
Did 600 tons Loads hit the Visor upwards every 4 Minutes?
|
Figure 13d shows the Z-force (vertical) in Hs=4,3 m bow waves, speed 14,5 knots (negative upward but not including the visor weight 0.53 MN). During 16 minutes 40 seconds the ship should meet about 150 waves (average). What is totally recorded in figure 13d is 4 wave loads - 2.7% -(impacts) > 6 MN (maximum 7.4 MN), 9 wave loads - 6% - (smaller but big impacts) between 3 and 6 MN, 12 wave loads (8%) between 2 and 3 MN (still impacts because the duration is short) and 16 wave loads 10.7%) between 1 and 2 MN in the upward direction (also short impact loads). The remaining wave loads - about 100 off (67%) - seems to have been smaller than 1 MN. Thus big wave loads - impacts - were very frequent according to this test - every 4 minutes the visor was slammed by an impact >600 tons (6 MN) upwards, every two minutes there was an impact >300 tons (3 MN) upwards and every minute an impact > 200 tons (2 MN). This is not the story in the 'Estonia' report (5)! Nodbody heard or felt big hundred tons impacts on the ship every minute! |
|
You could also compare with Figure 12.7 in the Final report (5) (page 158) where above is stated to be plotted; every minute the Z force may exceed 2 MN, every two minutes the Z force may exceed 3 MN but you need 50 minutes - not 4 minutes - to exceed 6 MN. Thus the results of Supplement No. 410 are not correctly copied in Figure 12.7 of the Final report (5).
Note that the results are given in full-scale time. When doing the actual model tests at scale 1/35, the model is slowed down and the time scale is 1/2.986. Thus 60 full-scale minutes are about 20 model minutes. The weight/force scale seems to be 1/42875 but how it is achieved is a mystery. You cannot just scale up a model force to full scale using a factor. The force consists of different components following different scale factors.
To me figure 13d (and also figure 12.3 in (5) above) seems faked. First it is never explained in the SSPA report how suddenly very big impacts occur against the visor - how and why solid water slams perpendicular against the visor plates and how the vertical component becomes every 4 minutes > 600 tons (full scale). An impact is not solid water! An impact is locally compressed air between the wave and the shell plate surface that suddenly escapes at a certain high pressure. Nevertheless - more or less at every pitching - every 6 seconds - the lifting force exceeds the visor weight in the model tests, which would mean that every 6 seconds the visor was lifted up from its supports - by compressed air? - and then came crashing down. But nobody heard these strange phenomena on the 'Estonia'. Evidently the model tests are faked. I am 100% certain about it.
The BIG Impact in the Model Tests
The report tries to explain the worst impact -7.4 MN (740 ton Z-force - about 1 000 ton total) at time 7 520 seconds, which apparently also caused an opening moment 35 MNm (figure 13e). A similar impact is shown in the lower photo of fig. 10 (even if the wrong speed is given). In figure 14a is shown the wave profile between times 7 510 and 7 530 seconds - nothing amazing - the wave heights are about 4-6-4 meters before, during and after the enormous impact 740 ton Z-force. In figure 14b the relative motion is shown as -3.1, -6.4 and -5.4 meters before, during and after the impact, i.e. the visor was submerged 3.95 meters (-6.4 meters relative motion) when the impact occurred - see the photo in fig 10. Figure 14d shows the impact with its peak just after the 7 520 second. During less than a second there is an impact force of 7.4 MN, viz. 740 tons, 6 seconds later there is another impact of 200 tons.
Here you have to ask yourself, if a 740 tons force ever hit the model (followed by a 200 tons load). In model scale it seems to be 17.26 kilograms. Nevertheless - how could it just develop and disappear in less than a second? When the visor starts to submerge, the increasing volume/buoyancy of the visor, it slows down the relative motion, as seen in the regular waves (see above) data, and how does then the impact develop? When I measured impacts (pressures) a very long time ago (at the Webb Institute laboratory, 1968) on a flat bottom (slamming), it seems that the impact was very sudden - bang - due to high local pressure and of short duration - it receded quickly, when the water dispersed. And slamming was not very frequent! A wave impact on the bow aboard a real ferry is heard all over the ship and you slow down immediately.
The Energy Content
Now, another question is of course, if there was enough energy in the very short impact at time 7 520 seconds of 7.40 MN, which lasted less than a second, to damage the visor locks?
The SSPA report does not answer that question. Nowhere is it ever stated that a short impact load can damage the visor locks. In my simple opinion the alleged impact load of 740 tonnes in upright condition during less than a second (I do not think it really existed) would easily have been transmitted to the hull via the worn Atlantic lock - 100-200 tons - the worn side locks - 2 x (100-200) tons and the worn hinges 2 x (200-350) tons > total 800 tons strength, and the sudden impact - if it occurred (I doubt it) - would only have deformed the locks and hinges and jammed the visor. It is more logical to assume that the visor was ripped off sideways by a wave impact, when the list was 40-50 degrees, when the impact load was very big 600-700 tons and when the locks were not efficient - they could not keep the visor in place sideways. But the visor was probably still attached to the ship when it sank.
However, I am ready to accept the possibility, that the visor was blown off by an explosion between the visor and the ramp - under water after the accident; it would explain how the side locks pulled out the plates they were welded to (but I do not understand, why anybody would cause an explosion - under water - between the ramp and the visor - it would achieve nothing except blowing off the visor and keeping the ramp closed).
The SSPA report says in the Summary, that model tests have been done and that a highest upward vertical force of 7.4 MN was recorded. Basta! It is suggested it is an 'impact'. The ulitmate faking was then probably done by Stenström in Dagens Nyheter 25 August 1995, where he informed the results; that model tests (done June 28-July 1, 1995) had proved that only one wave could have caused the whole accident - one big force had ripped away the visor 1.19. But evidently the SSPA report does not say that.
False Simulations of the vertical Force
The Final report (5) also simulates the loads (Z-forces). The simulation (blue in Figure 12.7 of (5)) suggests it takes 800 hrs (!) before the Z force > 6 MN! Why is that? What is a simulated Z force? According to (5 - page 157) it is a combination of
(a) the weight of the visor,(b) the inertia force,
(c) the hydrodynamic force due to added mass and damping,
(d) the hydrostatic buoyancy force,
(e) the Froude-Krylov force,
(f) the non-linear vertical impact force and
(g) the force due to stationary flow around the submerged visor.
This is interesting: (a) is known - 0.53 MN constant downwards!, (b) is known, if we know the acceleration, (c) is known - say 30% of d, (d) is known (the volume of the visor below water) acting upwards against (a), (e) is known and small like (g). But (f)? How do you simulate the non-linear vertical impact force upwards? The Final report (5) doesn't say and according to the writer it does not exist any method to simulate impact loads on visors! Thus the simulations cannot be true (even if they show much smaller loads than the loads measured in the model tests).
You should look at the time series of the model tests, e.g. figure 12.3 of (5) and figure 13d of supplement no. 410. Suddenly - within a fraction of a second the vertical Z force changes from 0 to say > 6MN (600 tons!). This change is evidently not due to (a) a sudden change in the weight of the visor (0.53 MN constant), or (b) the inertia force (it changes slowly 0,2-0,3 g = 0.12-0.18MN with the motion period), or (c) the hydrodynamic force (max 0.12-0.15 MN), or (d) the hydrostatic buoyancy force (max 0.4-0.5 MN) opposing (a) or (e) the Froude-Krylov force or (g) the stationary flow force (negligible).
All the simulated forces (a)+(b)+(c)+(d)+(e)+(g) should result in a combined load of about - zero or < 1 MN!
The only real load of interest is (f) the non-linear vertical impact fore - and it does not exist any method to simulate it! The 'impact' is just local high pressure. Thus the alleged very bad comparison of simulated and modelled data in figure 12.7 is based on false information. The simulated data cannot have been computed (simulated) and the modelled data are probably 100% false.
Thus the statements in chapter 12.2.4 in the Final report (5) are false:
"Qualitatively the simulated results agree well with the experimental data".
This statement is a lie to support the false experimental data. Obviously anyone asking the question how a 700 ton force could have been measured in model tests would only have been dismissed by the statement that simulations produce similar loads.
"The experimental time histories of the vertical load on the visor have high upward peaks similar to those of the simulated records and in the downward direction the loads are negligible".
It is more probable that the very high upward modelled peaks are false as no simulated records exist to support the experimental data.
The sudden opening Moment
Another very important observation is in fig 13e and fig 14F showing the Yh-moment (MNm) - Positive opening, i.e. the opening moment only lasts less than half a second - then it is gone! This means of course that the opening moment can never open the visor! It is of too short duration! Also, as soon as the visor opens, it fills with water and becomes heavier. Water then does not act only on the outside of the visor, but also on the inside and reduces the opening moment. This means that the visor never could have flipped up and down during 10 minutes as stated by JAIC in the Final Report. Also, water in the visor reduces the load transmitted to the locks by an outside force.
To me the SSPA tests are faked and misleading. The report presents only 1 000 seconds of tests in irregular seas, 9.25% of the total 3 hours test - 10 800 s, and in this very short time - 1 000 seconds - the visor was allegedly hit 4 times by very big impacts >6 MN (600 tons) upwards. Every four minutes the visor was hit by a 600 tons impact. This is what the SSPA report says, but this is not what the Final Estonia report or any false simulations says - there the impacts are much, much rarer.
How the Falsifications were done
Probably SSPA Marine AB (Trägardh) was told by Stenström to produce a test with many big impacts, which Stenström thought could have ripped off the visor, and it was produced by SSPA. The media was of course informed about the big, recorded load peaks - they had ripped off the visor. Probably they faked the Z-force (and X-force?) gauge to record higher values. Then Stenström realised that the SSPA report produced too many big impacts, but then it was too late to change. The report does not say what happens aft with the propellers - were they in the water all the time?
Witnesses aboard never heard any of the big impacts forward every four minutes prior to the accident. So the JAIC had to fake the survivors testimonies also.
I do not believe the SSPA report - the Z- and X-forces recorded seem much (10 times) too high to reflect actual conditions and any alleged 'smulations' to support the peaks are false. The only possibility seems that the gauges were manipulated to record higher than actual loads in the model tests or that the printed records have been manipulated manuallly afterward. This matter should be investigated. It is very sad that SSPA Marine AB, the only Swedish ship testing tank, was forced to participate in the cover-up of the 'Estonia' accident. The SSPA Marine AB has evidently been asked to comment on above and has refused to answer.
---